
Viktor Griffin · 16 September 2026
Digitized Coastal Charts Guide Preservation Efforts Against Erosion at Aging Waterfront Landmarks
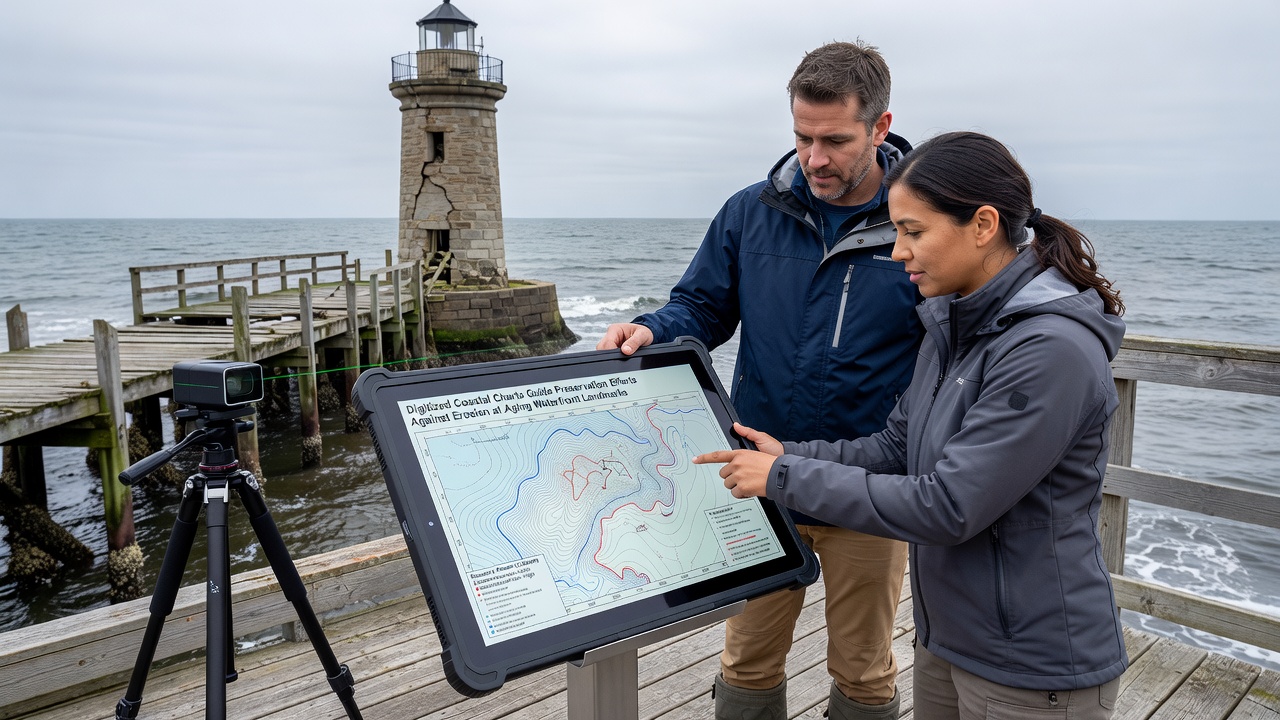
Coastal landmarks built decades or centuries ago now face accelerating shoreline retreat, and digitized versions of old nautical charts have become central tools for tracking those changes. Researchers compare historical soundings and shoreline positions from paper maps created in the early 1900s with modern lidar and multibeam sonar surveys, revealing measurable land loss at sites such as 19th-century piers, breakwaters, and harbor warehouses. Data compiled by the National Oceanic and Atmospheric Administration shows average annual erosion rates of 0.5 to 2 meters along many Atlantic and Gulf segments where these structures stand, prompting preservation teams to prioritize interventions based on precise spatial overlays rather than anecdotal observation.
Historical Charts Meet Modern Mapping Technology
Archivists at several national hydrographic offices began scanning and georeferencing paper charts in the 1990s, yet only in the last decade have processing speeds and resolution improvements allowed routine integration with contemporary elevation models. Teams align features such as mean high water lines and submerged contours from charts dated 1925 with 2024 datasets, producing time-series animations that quantify sediment movement around aging timber pilings and stone revetments. One project completed in 2023 at a New England fishing port demonstrated that a 120-meter wharf had lost 18 meters of supporting sediment since the original chart was published, information that guided targeted placement of new rock armor rather than full reconstruction.
Software platforms now automate much of the georeferencing step, reducing manual error that once limited accuracy to tens of meters. When combined with satellite-derived shoreline vectors updated every six months, the resulting models support predictive simulations of future erosion under different sea-level scenarios. Engineers working on a California waterfront warehouse district used these simulations in early 2025 to test whether elevating a 1940s concrete pier by 1.2 meters would remain viable through 2050, and the analysis indicated that additional groin structures would be required to maintain sediment supply.
Case Applications at Specific Landmarks
Preservation groups in the Pacific Northwest have applied the same chart-comparison method to a series of 1930s-era ferry terminals threatened by increased wave energy after nearby sandbars migrated. Overlay analysis showed that the terminals now sit 14 meters closer to the active surf zone than they did when first charted, prompting installation of floating wave attenuators designed with input from the updated bathymetry. Similar work along the Great Lakes, where water levels fluctuate more than open-ocean tides, has helped identify which historic lighthouse foundations require additional toe protection before winter storm seasons.
European agencies have adopted parallel approaches. The European Environment Agency maintains a harmonized coastal database that incorporates digitized admiralty charts from multiple member states, allowing cross-border comparison of erosion trends near shared historic harbors. In one documented instance, data from the 1938 edition of a Danish port chart revealed that a masonry seawall built in 1872 had already experienced 9 meters of foreshore narrowing by 2018, leading to a joint Danish-German reinforcement project scheduled for completion before September 2026.
Data Sources and Integration Challenges
Accuracy depends on careful handling of vertical datum shifts and projection differences between old and new surveys. The Canadian Hydrographic Service publishes correction tables that convert legacy soundings referenced to older tidal benchmarks into modern chart datum, yet many smaller municipalities still lack staff trained to apply those tables consistently. Academic researchers at several universities have begun offering short courses that walk local planners through the process, and participation has grown from 40 attendees in 2022 to more than 180 in 2025.
Public access portals now host the georeferenced chart layers alongside real-time tide gauge readings and wave buoy reports, allowing anyone with an internet connection to inspect conditions near specific landmarks. One open-data initiative launched in Australia aggregates state-level coastal surveys with digitized Royal Australian Navy charts from the 1950s, producing a national erosion dashboard updated quarterly. Figures from that dashboard indicate that 23 percent of surveyed heritage-listed waterfront sites show accelerated retreat compared with the 1990-2010 baseline period.
Future Outlook and Scheduled Updates
Agencies plan to release a new global coastal change layer in September 2026 that will incorporate high-resolution satellite imagery collected through 2025, extending coverage to additional regions where paper charts were only recently digitized. The layer is expected to include uncertainty estimates for each shoreline position, giving preservation planners clearer guidance on where field verification remains necessary. Continued refinement of machine-learning algorithms that automatically extract features from both historical scans and current imagery should further reduce the time required to produce updated overlays, allowing more frequent monitoring cycles at sites already identified as high risk.
Conclusion
Digitized coastal charts therefore function as both historical record and active planning instrument, supplying the spatial context required to protect aging waterfront landmarks from ongoing erosion. By linking past survey data with present measurements, agencies and local groups obtain actionable evidence for selecting stabilization techniques, scheduling maintenance, and allocating limited preservation funds. As new releases become available and processing tools improve, the same datasets will support longer-term adaptation strategies that account for changing coastal dynamics through the coming decades.